TL;DR:
- Power BI is ideal for Microsoft-based organizations due to its cost, AI features, and native integration. Tableau suits teams needing advanced visual analytics and multi-cloud data connectivity, especially with Salesforce. Both platforms depend on analysts to develop dashboards, while Cannatract offers custom AI automation to reduce bottlenecks.
Power BI wins for Microsoft-first organizations. Tableau wins for teams that live in Salesforce or need maximum visual expressiveness. Neither is universally superior, and the honest answer depends on three things: where your data already lives, how much analyst dependency you can tolerate, and what you're willing to pay.
Here's the short version before you read further:
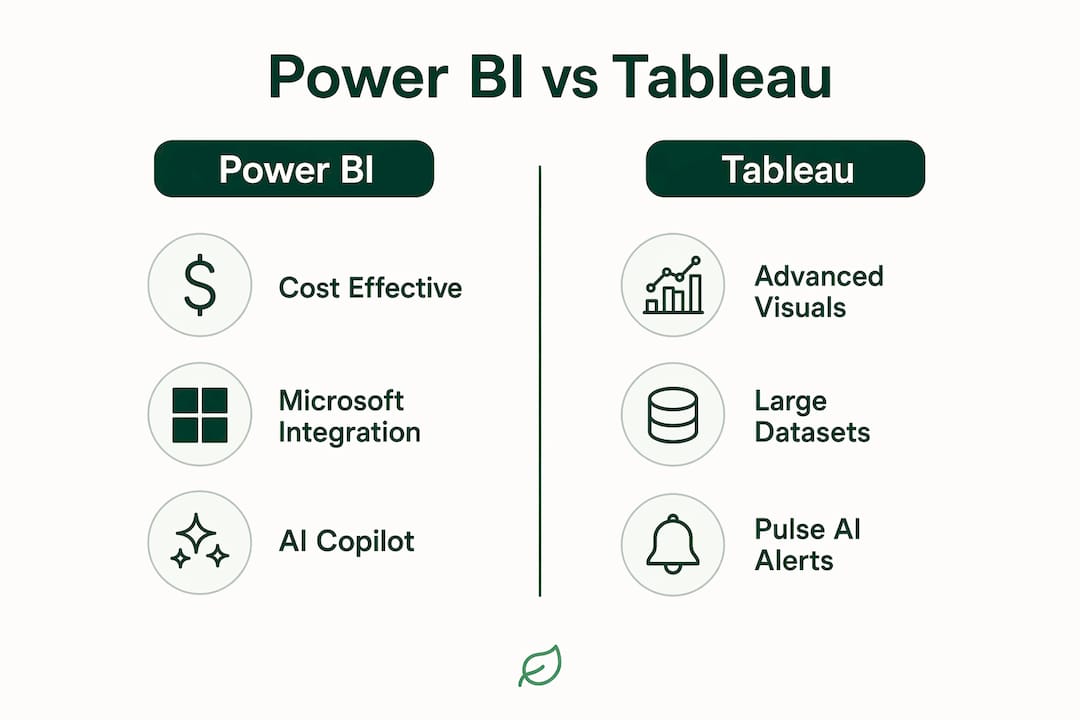
- Power BI fits organizations running Microsoft 365, Azure, or Fabric. Power BI Pro costs approximately $14/user/month versus Tableau Creator at $75/user/month, a gap that's hard to ignore at any scale below a few hundred users.
- Tableau fits analyst teams that need rich, freeform visualizations, exploratory analytics across large multi-source datasets, or deep Salesforce CRM integration.
- Both platforms require technical analysts to build and maintain dashboards. Business users consume what analysts create. That dependency is the shared limitation neither vendor has fully solved.
- AI maturity differs sharply. Microsoft Copilot for Power BI is more capable and more integrated today. Tableau Pulse and Salesforce Einstein are improving but sit behind a Tableau+ subscription paywall.
- Ecosystem lock-in is real. Switching costs grow the deeper you go into either stack.
Table of Contents
- How do Tableau and Power BI actually compare across the dimensions that matter?
- What should actually drive your decision?
- What Cannatract builds when dashboards aren't enough
- FAQ
- Key Takeaways
How do Tableau and Power BI actually compare across the dimensions that matter?
| Dimension | Power BI | Tableau | Microsoft Copilot for Power BI | Tableau Pulse / Einstein | Cannatract |
|---|---|---|---|---|---|
| Best for ecosystem | Microsoft 365, Azure, Fabric | Salesforce, multi-cloud, heterogeneous stacks | Microsoft Fabric F64+ environments | Salesforce Data Cloud orgs | Any stack; custom-built integrations |
| AI feature maturity | High: Copilot generates DAX, creates visuals, summarizes reports | Moderate: Pulse detects anomalies; Einstein adds predictive modeling | Highest among BI tools; natural language to DAX | Proactive metric summaries; gated behind Tableau+ | Bespoke AI agents built to your workflow |
| Data volume handling | Strong for Azure-native data; import model strains at scale | Hyper engine handles very large extracts across multi-source blends | Inherits Power BI's model; best with pre-aggregated data | Separate from core dashboarding; anomaly-focused | Depends on integration design |
| Cost efficiency | Lowest entry point; Pro included in Microsoft 365 | Creator at $75/user/month, roughly 5x Power BI Pro | Requires Fabric F64+ capacity SKU | Requires Tableau+ add-on | Fixed project quotes; no per-seat licensing |
| Visual storytelling | Structured layouts; strong formatting controls | Freeform design; superior chart depth and spatial visualization | Generates visuals from prompts | Personalized metric summaries | Custom dashboards and reporting tools built to spec |
| User self-service vs. technical dependency | Business users consume; DAX authoring requires training | Analysts love it; non-technical users need support | Reduces DAX friction via natural language | Proactive delivery reduces dashboard dependency | Eliminates the analyst bottleneck entirely |
Ecosystem and integration depth
Power BI integrates natively with Azure Synapse, Microsoft Fabric, SharePoint, Teams, Dynamics, and Dataverse. For organizations already running Microsoft 365, that means near-zero configuration overhead. Tableau connects to Snowflake, Databricks, and heterogeneous on-premises sources more gracefully, which matters when your data isn't centralized in one cloud.

One practical difference most comparisons understate: Power BI supports native calculated tables using DAX directly inside the platform. Tableau requires external data sources for calculated tables like date spines, which introduces broken-link risk and workflow friction.
AI capabilities: Copilot vs. Pulse vs. Einstein
Microsoft Copilot for Power BI generates DAX formulas, creates visuals from natural language prompts, and summarizes reports end-to-end. It's the most capable built-in AI assistant in enterprise BI as of mid-2026. The catch: you need a Fabric F64+ capacity SKU to access it, which pushes costs well past the $14/user/month headline price.
Tableau Pulse delivers proactive metric summaries and automatic anomaly detection, but it operates separately from the main dashboard experience. Salesforce Einstein adds predictive modeling and what-if scenario analysis for teams embedded in Salesforce Data Cloud. Both require the Tableau+ subscription, not the base plan.
Security, governance, and collaboration
Power BI enforces row-level security at the semantic model level. Define it once, and every report built on that model inherits it automatically. Tableau implements row-level security through user filters or Virtual Connections, which requires deliberate per-workbook configuration. Power BI also integrates natively with Microsoft Entra ID for permission management, while Tableau maintains its own user model with SSO options that need separate administration.
For collaboration, Power BI works naturally inside Microsoft Teams and SharePoint. Tableau Server and Tableau Cloud offer strong sharing capabilities but require more onboarding for less technical teams.
What should actually drive your decision?
Choosing between these platforms isn't a feature checklist exercise. It's a strategic question about where your organization is anchored and where it's heading.
Start with your data stack. If 80% of your data lives in Azure and your team runs Microsoft 365, Power BI wins on cost, AI maturity, and integration depth. If you're connecting to Snowflake, Databricks, multiple on-premises databases, and a Salesforce CRM simultaneously, Tableau handles that complexity more consistently.
Then calculate total cost of ownership honestly. The per-user license gap is real, but it narrows at enterprise scale once you add Fabric capacity for Copilot features. Organizations with 200+ users and heavy Premium reliance often reach comparable total cost, making the decision less about price and more about fit.
Key factors to weigh before you commit:
- Analyst dependency: Both platforms require technical gatekeepers to build and maintain dashboards. Business users typically can't ask new questions without filing a request. If that bottleneck is costing you decisions, no dashboard tool fully solves it.
- Mac vs. Windows: Power BI Desktop runs on Windows only. Tableau supports both Mac and Windows, which matters for analyst teams on mixed hardware.
- Calculation complexity: Tableau's calculation language is more readable and supports advanced Level of Detail expressions. Power BI's DAX is powerful but notoriously difficult to master, though Copilot is reducing that friction.
- AI governance: Copilot and Pulse both work best with clean, pre-aggregated data. Neither delivers reliable answers from raw, ungoverned sources.
- Scaling costs: Both platforms can have hidden costs that emerge as adoption grows. Factor in analyst time, dashboard maintenance, and data movement alongside license fees.
The market reality is that most medium and large enterprises default to Power BI simply because they're already running Microsoft 365. That's a legitimate reason to choose it. However, if your analytics goals center on visual storytelling, executive presentations, or exploratory analysis across complex multi-source environments, Tableau's premium is defensible.
Pro Tip: Before signing any BI contract, map out your top five recurring reporting workflows and estimate the analyst hours required to build and maintain them annually. That number often exceeds the license cost difference between the two platforms and changes the total cost calculation entirely.
For AI-driven workflow automation that goes beyond dashboards, both platforms have a ceiling. Custom AI agents can answer operational questions directly, without requiring an analyst to build a new report first. That's worth evaluating alongside any BI selection decision, particularly if your team is already experiencing dashboard bottlenecks.
What Cannatract builds when dashboards aren't enough
Most BI tools are reporting layers. They show you what happened. Getting answers to why it happened, or automating what comes next, still requires an analyst, a developer, or a ticket queue.
Cannatract builds custom AI agents and workflow automations that plug directly into your existing data sources, CRM, billing systems, and operations. Instead of waiting for a dashboard refresh, your team gets answers delivered to the right person at the right time, automatically. A working system typically ships within a few weeks, with a fixed quote upfront and no open-ended monthly retainer.
For operations managers who've hit the ceiling of what Power BI or Tableau can automate, the free automation audit at Cannatract identifies the single workflow costing your team the most time and scopes a solution with a clear price attached. No vague proposals, no bait-and-switch pricing.
FAQ
Is Power BI cheaper than Tableau?
Yes. Power BI Pro costs approximately $14/user/month versus Tableau Creator at $75/user/month, though enterprise deployments requiring Copilot or Premium features may narrow that gap.
Which tool handles larger datasets better?
Tableau's Hyper engine handles very large extracts and multi-source data blending more consistently. Power BI's Direct Lake mode in Fabric closes the gap for Azure-native data, but Tableau performs more reliably across mixed on-premises and cloud sources.
Can non-technical users work independently in either platform?
Not easily. Both platforms require analysts to build dashboards that business users then consume. Creating new analyses or asking follow-up questions without analyst support remains difficult in both tools.
What is Tableau Pulse and do I need it?
Tableau Pulse delivers proactive metric summaries and anomaly detection outside the main dashboard experience. It requires a Tableau+ subscription and suits Salesforce-centric enterprises focused on organizational metric monitoring rather than ad-hoc exploration.
When does Cannatract make sense alongside a BI tool?
When your team is hitting the analyst bottleneck repeatedly, Cannatract's custom AI agents can automate the decision and action layer that sits above any dashboard. It complements Power BI or Tableau rather than replacing them.
Key Takeaways
Power BI wins on cost and AI maturity for Microsoft-first organizations; Tableau wins on visual depth and large-dataset handling for analyst-driven or Salesforce-anchored teams.
| Point | Details |
|---|---|
| Cost gap is significant | Power BI Pro at approximately $14/user/month versus Tableau Creator at $75/user/month; the gap narrows at enterprise scale with Fabric capacity costs. |
| AI maturity favors Power BI | Microsoft Copilot for Power BI generates DAX and creates visuals from prompts; Tableau Pulse and Einstein require a Tableau+ add-on. |
| Ecosystem fit drives the decision | Microsoft 365 and Azure shops default to Power BI; Salesforce and multi-cloud environments favor Tableau's connector flexibility. |
| Both create analyst dependency | Neither platform lets business users ask new questions independently; dashboard bottlenecks slow decisions in both tools. |
| Cannatract fills the automation gap | Custom AI agents ship in 2–4 weeks with fixed quotes, automating the decision and action layer above any BI dashboard. |